November 25, 2024
The Quest for the Perfect Nav Log (Part 3 - Performance)
Welcome to Part 3 of the “Quest for the perfect nav log” series. Building on the first couple of episodes, we’ll review how to build a database of performance figures so we can automate the performance calculations required to build our navigation log.
Building the database
The first step to automate our performance computations is to build a database with the performance information taken from Section 5 of your Pilot Operating Handbook (POH). Depending on how your performance data is published, loading it into Google Sheets may range from straightforward to quite challenging. Our goal is to compile performance data for the primary phases of flight, which include takeoff and landing distances, best rate of climb, time/fuel/distance to climb, and cruise performance. For multi-engine aircraft, it’s essential to include data for the best one-engine inoperative (OEI) climb rate, accelerate-stop, and accelerate-go distances. Typically, I aim for data points in 10°C increments (whether referring to OAT or ISA deviation) and 1,000-foot pressure altitude increments. Cruise performance data increments can vary based on the manufacturer’s publication.
Tips on Compiling Performance Data
After creating performance databases for over 10 different aircraft types, here are a few insights to make the process more efficient, depending on how your performance data is presented.
1. Recent POHs in PDF Format with Tabular Data
If your aircraft’s POH is relatively modern and published as a PDF with tabular data, you’re in luck. When the text in the PDF can be selected using the cursor, extracting the data is much simpler. Examples of aircraft with POHs published as native PDF files include the Cirrus SR2x series, Columbia/Cessna 350/400/TTx, and Diamond DA42 NG/VI and DA62. In such cases, copying and pasting tables directly into Google Sheets may work. However, for a more robust solution, I recommend using Tabula. Originally designed for investigative journalists, Tabula is an excellent tool for converting PDF tables into structured CSV data while preserving row and column alignment. Simply install Tabula, open your PDF, select the tables you need, and let the software handle the rest.
2. Older POHs with Scanned Image PDFs
If you’re dealing with an older POH that’s a scanned document, extracting data becomes more complex. I have found that my Mac’s native Optical Character Recognition (OCR) capability in the Preview app is a reliable tool for this purpose. It enables you to copy and paste from Preview into Google Sheets, though the process requires careful review, as OCR can misalign data. In some instances, I’ve had to revert to fully manual data entry may be necessary to ensure accuracy.
3. Graphical Performance Data
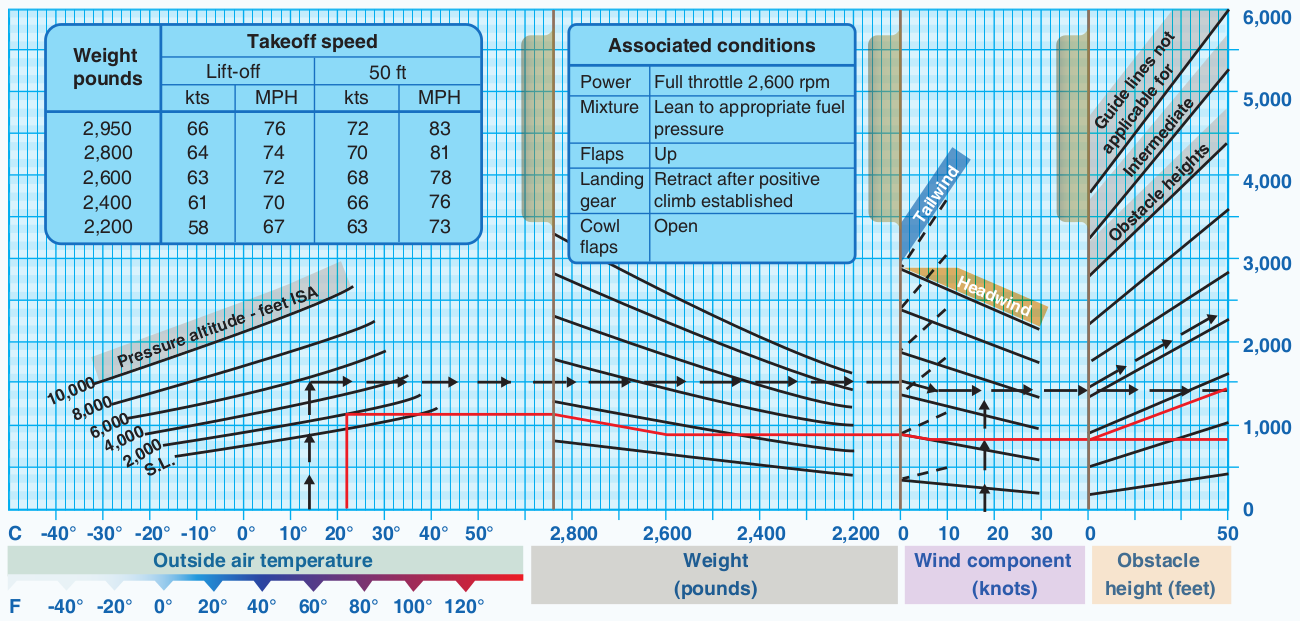
For POHs that present performance data graphically, such as the Lycoming-powered Diamond DA40 or the DA42-TDI (and many more aircraft types), extracting data can be a significant undertaking. In these cases, you’ll need to manually derive the data from the chart. For instance, to build a takeoff performance table, I collect data points for ground roll and total takeoff distance at various OATs (0°, 10°, 20°, 30°, 40°C) and pressure altitudes (sea level, 1,000, 2,000 feet, etc.). While this process is labor-intensive, it results in an in-depth understanding of your aircraft’s performance capabilities. When compiling data, I recommend computing performance figures at maximum gross weight and with no wind component to maintain simplicity. This conservative approach provides performance estimates that are safe and reliable.
To streamline data extraction from charts, consider using tools like Automeris or DigitizeIt. These programs allow you to upload an image of the chart, calibrate the axes, and output the coordinates of data points. I’ve had particularly good results with DigitizeIt. Although I have not yet explored the use of GPT-4 Vision capabilities for this task, doing so would require rigorous validation to ensure accuracy.
If you’re curious, my data includes the Cessna 172 (N-160, N-180, P, and S models), Cessna 182 (Q and T models), Cirrus SR20 and SR22T (G6 models), Columbia 400, Diamond DA40 Lycoming, Diamond DA42 (TDI, NG, and VI models), and Diamond DA62. It now contains over 12,000 lines of data! While I don’t share this data publicly for liability purposes, feel free to get in touch directly if you need any help compiling your performance data.
An Example
Let’s take the example of the cruise performance data of the Cirrus SR22 Turbo G6. With a maximum altitude of 25,000ft, that’s quite a lot of pressure altitudes to compile, so we’ll only look at a subset of what your database should include. Here is how Cirrus publishes the cruise performance data:
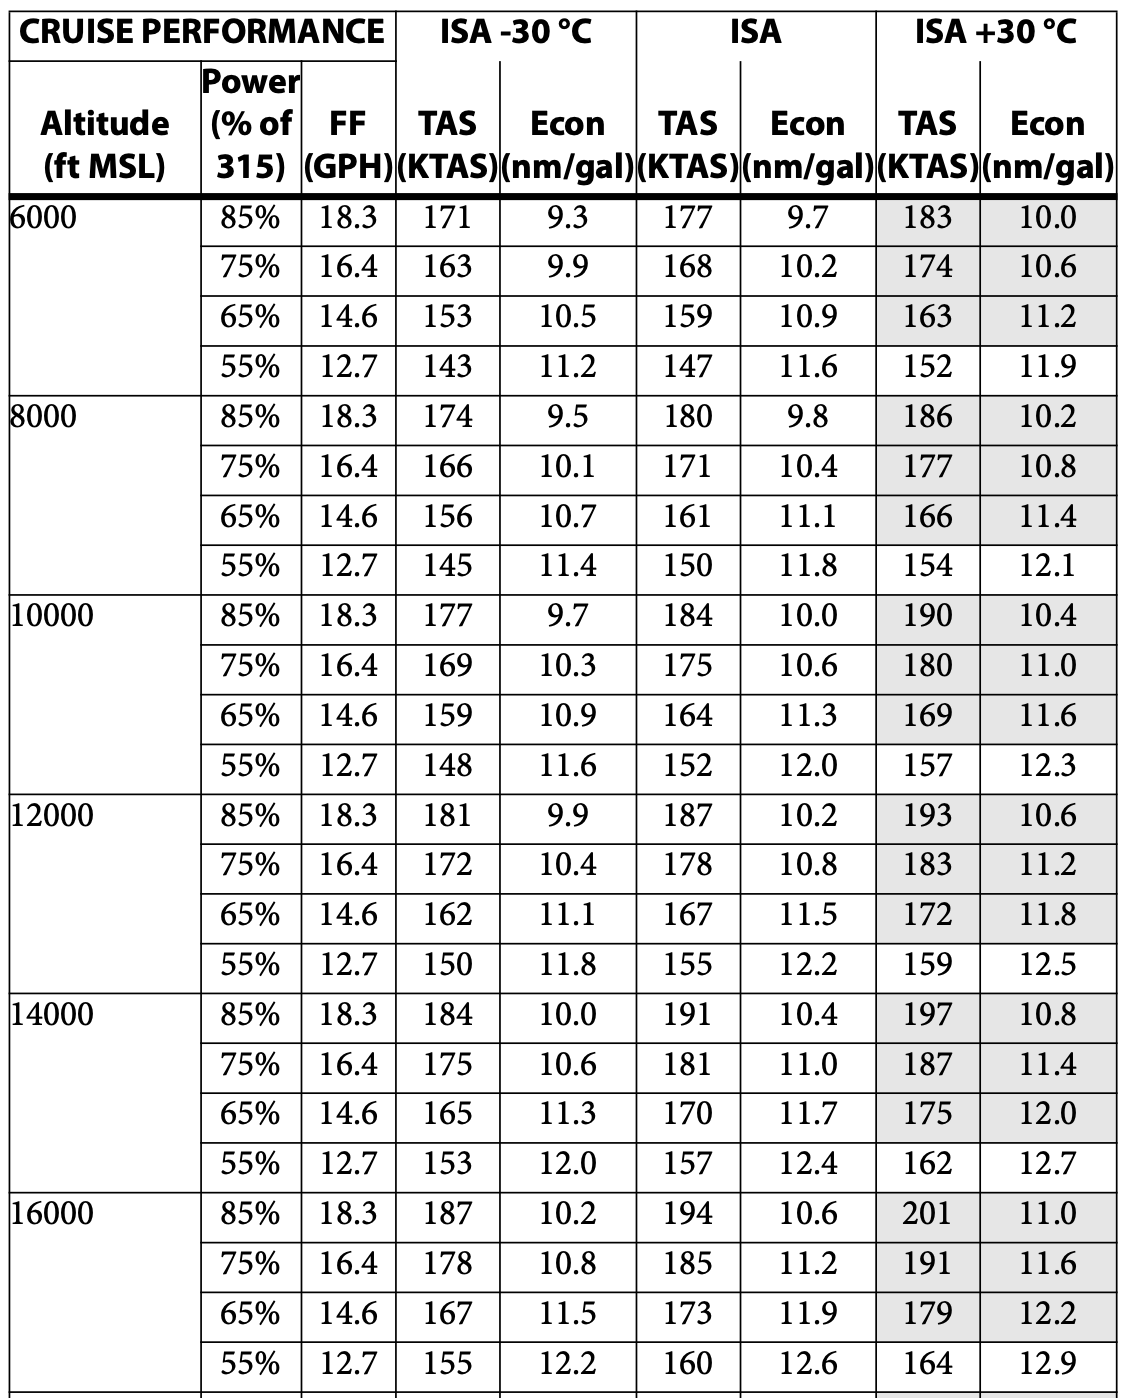
Follow along the example worksheet here. Copying the values (without the table headers) and pasting them in Google Sheets works well enough (in the first tab of the worksheet, see Step 1). The values are pasted in one cell per line, with a space in-between each value. Google Sheets “Split text to columns” feature makes it easy to split each cell into several columns (see Step 2). Because the altitude is not repeated on each line, there is also some realignment that must happen which is quite straightforward (see Step 3). Using Tabula would take you to that step pretty much all in one go. Because the copy-paste works so well for that POH, I wouldn’t necessarily go through all the hoops of using Tabula. I also like to bring the table back to just one dimension by adding a column for the ISA temperature input, and cut-pasting the values as required. It makes it a lot easier to search through the data later (see Step 4 in the example worksheet). We now have a well-structured table with the published cruise performance.
Next up, I like to compute extrapolated values for each 1,000ft increment of pressure altitude and 10°C of difference with ISA so I can easily retrieve data for a variety of conditions. For that, I will compute values for odd altitudes by averaging the values for the next higher and next lower even altitude (in the second tab of the worksheet, see Step 1), and then compute values for +/- 10°C and 20°C vs ISA. To make the table easily searchable using the XLOOKUP function, I create a search key which is simply a concatenated string of all three input parameters. I then use a combination of AVERAGE, XLOOKUP, and CONCATENATE to find the value for the intermediate altitudes. I repeat the same process for OAT values, this time using a 1/3-2/3 weighing instead of an average.
To conclude
And with that, we’ve now obtained a searchable database of the cruise performance for a subset of the usable altitudes with our aircraft. Add that to a list of airports and fixes, and we start to be able to automate a lot of the work required to put a navigation log together. Following the same logic, you can automate computing takeoff and landing distances. In future posts, we’ll look at other components of performance that we can compute automatically, specifically the top of climb and the associated fuel required to climb.